echart
本例中我们将改造echarts官网的一个示例,在自定义组件中显示,连接数据源后显示我们自己的数据。 点击查看echart官方示例
首先我们在线创建一个自定义组件。然后我们需要修改config.json文件。
config.json
{
"develop":{
"html":"index.html",
"css":[],
"entry":"main.js",
"scripts":{
}
},
"plugins":["echarts"],
"libs":[],
"services":["$customService"],
"customAttributes":{
"pro":[{
"type":"BgSize",
"name":"尺寸",
"callback":"outSizeCallBack"
}],
"con":[
{
"type":"BiDatasourceConfigComponent",
"customInput":{
"dimensionCount":1,
"measureCount":1,
"widgetCanDrillDown":true
},
"setDataParams":{
"simple":true
}
}
]
}
}
我们plugins属性中添加配置echarts插件。因为我们用到了$customService,所以在serivices中添加$customService的配置。
我们在customAttributes中配置了尺寸组件和数据源组件。
html中只保留一个body和入口div。
index.html
<body>
<div id="_#visroot#_" class="_#customWidget#_">
</div>
</body>
js代码中添加$customService和echarts的引用
(function(option){
var echarts=window.plugins.echarts;
return {
$data:{
$customService:null,
properties:null
},
$hooks:{
onInit(properties){
this.properties=properties;
this.$customService=window.services.$customService;
},
onDestroy(){
console.log('销毁')
},
setData(data,obj){
}
},
$methods:{
}
}
})
下一步添加echarts代码
(function(option){
var echarts=window.plugins.echarts;
return {
$data:{
$customService:null,
properties:null
chart:null,
option:null
},
$hooks:{
onInit(properties){
this.properties=properties;
this.$customService=window.services.$customService;
this.echartsInit();
},
onDestroy(){
console.log('销毁')
},
setData(data,obj){
}
},
$methods:{
echartsInit(){
this.chart = echarts.init(document.getElementById('_#visroot#_'));
this.option = {
backgroundColor: 'rgba(0,0,0,0)',
title: {
text: '饼图',
left: 'center',
top: 20,
textStyle: {
color: '#ccc'
}
},
tooltip: {
trigger: 'item'
},
series: [
{
name: '访问来源',
type: 'pie',
radius: '55%',
center: ['50%', '50%'],
data: [
{value: 335, name: '直接访问'},
{value: 310, name: '邮件营销'},
{value: 274, name: '联盟广告'},
{value: 235, name: '视频广告'},
{value: 400, name: '搜索引擎'}
].sort(function (a, b) { return a.value - b.value; }),
roseType: 'radius',
label: {
color: 'rgba(255, 255, 255, 0.3)'
},
labelLine: {
lineStyle: {
color: 'rgba(255, 255, 255, 0.3)'
},
smooth: 0.2,
length: 10,
length2: 20
},
itemStyle: {
color: '#c23531',
shadowBlur: 200,
shadowColor: 'rgba(0, 0, 0, 0.5)'
},
animationType: 'scale',
animationEasing: 'elasticOut',
animationDelay: function (idx) {
return Math.random() * 200;
}
}
]
};
this.chart.setOption(this.option);
}
}
}
})
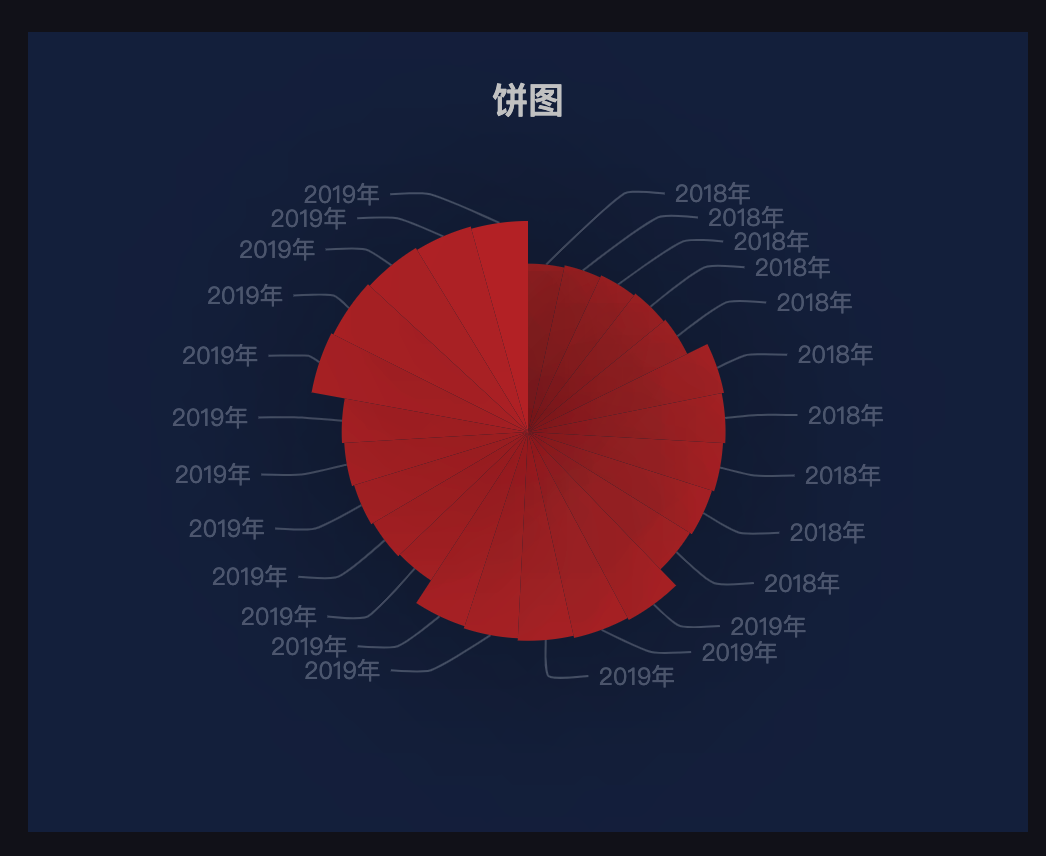
目前点击运行按钮,已经可以看到饼图的效果了,其中的数据是默认的。下一步我们要接入数据源返回的数据。
在setData方法中添加代码。
(function(option){
var echarts=window.plugins.echarts;
return {
$data:{
$customService:null,
properties:null
chart:null,
option:null
},
$hooks:{
onInit(properties){
this.properties=properties;
this.$customService=window.services.$customService;
this.echartsInit();
},
onDestroy(){
console.log('销毁')
},
setData(data,obj){
if(this.chart&&data&&obj&&data.data){
let dimensionList=this.$customService.getDataSourceDimensionColumns(obj.data);
let measureList=this.$customService.getDataSourceMeasureColumns(obj.data);
let dimensionKey=dimensionList[0]['column'];
let measurekey=measureList[0]['column']
let nameList=data.data[dimensionKey];
let dataList=data.data[measurekey];
this.updateData(nameList,dataList);
}
},
outSizeCallBack(info){
if(this.properties_){
$('#_#visroot#_main').css('height',this.properties_.style.height);
$('#_#visroot#_main').css('width',this.properties_.style.width);
}
}
},
$methods:{
echartsInit(){
this.chart = echarts.init(document.getElementById('_#visroot#_'));
this.option = {
backgroundColor: 'rgba(0,0,0,0)',
title: {
text: '饼图',
left: 'center',
top: 20,
textStyle: {
color: '#ccc'
}
},
tooltip: {
trigger: 'item'
},
series: [
{
name: '访问来源',
type: 'pie',
radius: '55%',
center: ['50%', '50%'],
data: [
{value: 335, name: '直接访问'},
{value: 310, name: '邮件营销'},
{value: 274, name: '联盟广告'},
{value: 235, name: '视频广告'},
{value: 400, name: '搜索引擎'}
].sort(function (a, b) { return a.value - b.value; }),
roseType: 'radius',
label: {
color: 'rgba(255, 255, 255, 0.3)'
},
labelLine: {
lineStyle: {
color: 'rgba(255, 255, 255, 0.3)'
},
smooth: 0.2,
length: 10,
length2: 20
},
itemStyle: {
color: '#c23531',
shadowBlur: 200,
shadowColor: 'rgba(0, 0, 0, 0.5)'
},
animationType: 'scale',
animationEasing: 'elasticOut',
animationDelay: function (idx) {
return Math.random() * 200;
}
}
]
};
this.chart.setOption(this.option);
},
updateData(nameList,dataList){
let option=this.chart.getOption();
let list=[];
for(let i=0;i<nameList.length;i++){
list.push({
"name":nameList[i],
"value":dataList[i]
})
}
option.series[0].data=list;
this.chart.setOption(option);
}
}
}
})
setData方法中第一个入参是返回的数据,第二个入参是数据源信息。
我们通过$customService.getDataSourceDimensionColumns和getDataSourceMeasureColumns方法将维度和度量信息提取出来。
拿到返回的维度数据和度量数据。
在updateData方法中又将数据处理成echarts所需要的格式。
连接数据源后展示的效果: