本例中我们将通过Hightcharts插件制作一个角锥柱形图的自定义组件。
首先需要编辑config.json配置文件。
因为我们要用到hghtcharts插件,所以在plugins中添加配置 "Highcharts"。
{
"develop":{
"html":"index.html",
"css":[],
"entry":"main.js",
"scripts":{
}
},
"plugins":["Highcharts"],
"libs":[],
"services":[],
"customAttributes":{
"pro":[],
"con":[]
}
}
我们需要在属性栏展示一个数据源的组件,所以在customAttributes.con下添加配置。
{
"develop":{
"html":"index.html",
"css":[],
"entry":"main.js",
"scripts":{
}
},
"plugins":["Highcharts"],
"libs":[],
"services":[],
"customAttributes":{
"pro":[],
"con":[
{
"type":"BiDatasourceConfigComponent",
"customInput":{
"dimensionCount":1,
"measureCount":1,
"widgetCanDrillDown":true
},
"setDataParams":{
"simple":true
}
}
]
}
}
如果你希望该组件显示的数据受其他组件的影响,例如说筛选器,那么可以在数据源下面增加参与组件过滤的配置
{
"develop":{
"html":"index.html",
"css":[],
"entry":"main.js",
"scripts":{
}
},
"plugins":["Highcharts"],
"libs":[],
"services":[],
"customAttributes":{
"pro":[],
"con":[
{
"type":"BiDatasourceConfigComponent",
"customInput":{
"dimensionCount":1,
"measureCount":1,
"widgetCanDrillDown":true
},
"setDataParams":{
"simple":true
}
},
{
"type":"ShadowTitleDisplay",
"name":"参与组件过滤"
}
]
}
}
像其他组件一样,在编辑态中打开这个开关后,组件的数据就会受其他组件影响了。
index.html文件
<body>
<div id="_#visroot#_" class="_#customWidget#_"></div>
</body>
用上面的代码替换掉默认index.html文件的内容。
main.js文件
默认创建后的js文件如下:
(function(option){
return {
onInit(){
console.log('钩子函数 onInit')
},
onDestroy(){
console.log('销毁')
},
setData(value){
}
}
})
我们可以重写成下面的样子:
(function(option){
return {
$data:{
},
$hooks:{
onInit(){
console.log('钩子函数 onInit')
},
onDestroy(){
console.log('销毁')
},
setData(value){
}
},
$methods:{
}
}
})
在首部添加highcharts插件。
(function(option){
var Highcharts=window.plugins.Highcharts;
return {
$data:{
},
$hooks:{
onInit(){
},
onDestroy(){
},
setData(value){
}
},
$methods:{
}
}
})
然后我们去highcharts官方的demo中,把相关的代码粘进来。
(function(option){
var Highcharts=window.plugins.Highcharts;
return {
$data:{
chart:null
},
$hooks:{
onInit(){
this.chart=Highcharts.chart('_#visroot#_', {
chart: {
type: 'columnpyramid'
},
title: {
text: '锥形图'
},
colors: ['#C79D6D', '#B5927B', '#CE9B84', '#B7A58C', '#C7A58C'],
xAxis: {
crosshair: true,
labels: {
style: {
fontSize: '14px'
}
},
type: 'category'
},
yAxis: {
min: 0,
title: {
text: '高度 (m)'
}
},
tooltip: {
valueSuffix: ' m'
},
series: [{
name: 'Height',
colorByPoint: true,
data: [
['Pyramid of Khufu', 138.8],
['Pyramid of Khafre', 136.4],
['Red Pyramid', 104],
['Bent Pyramid', 101.1],
['Pyramid of the Sun', 75]
],
showInLegend: false
}]
});
},
onDestroy(){
},
setData(data){
if(data&&data.data){
}
}
},
$methods:{
}
}
})
然后将 "var chart = Highcharts.chart('container', {" 其中的container替换成我们index.html中的id:_#visroot#_
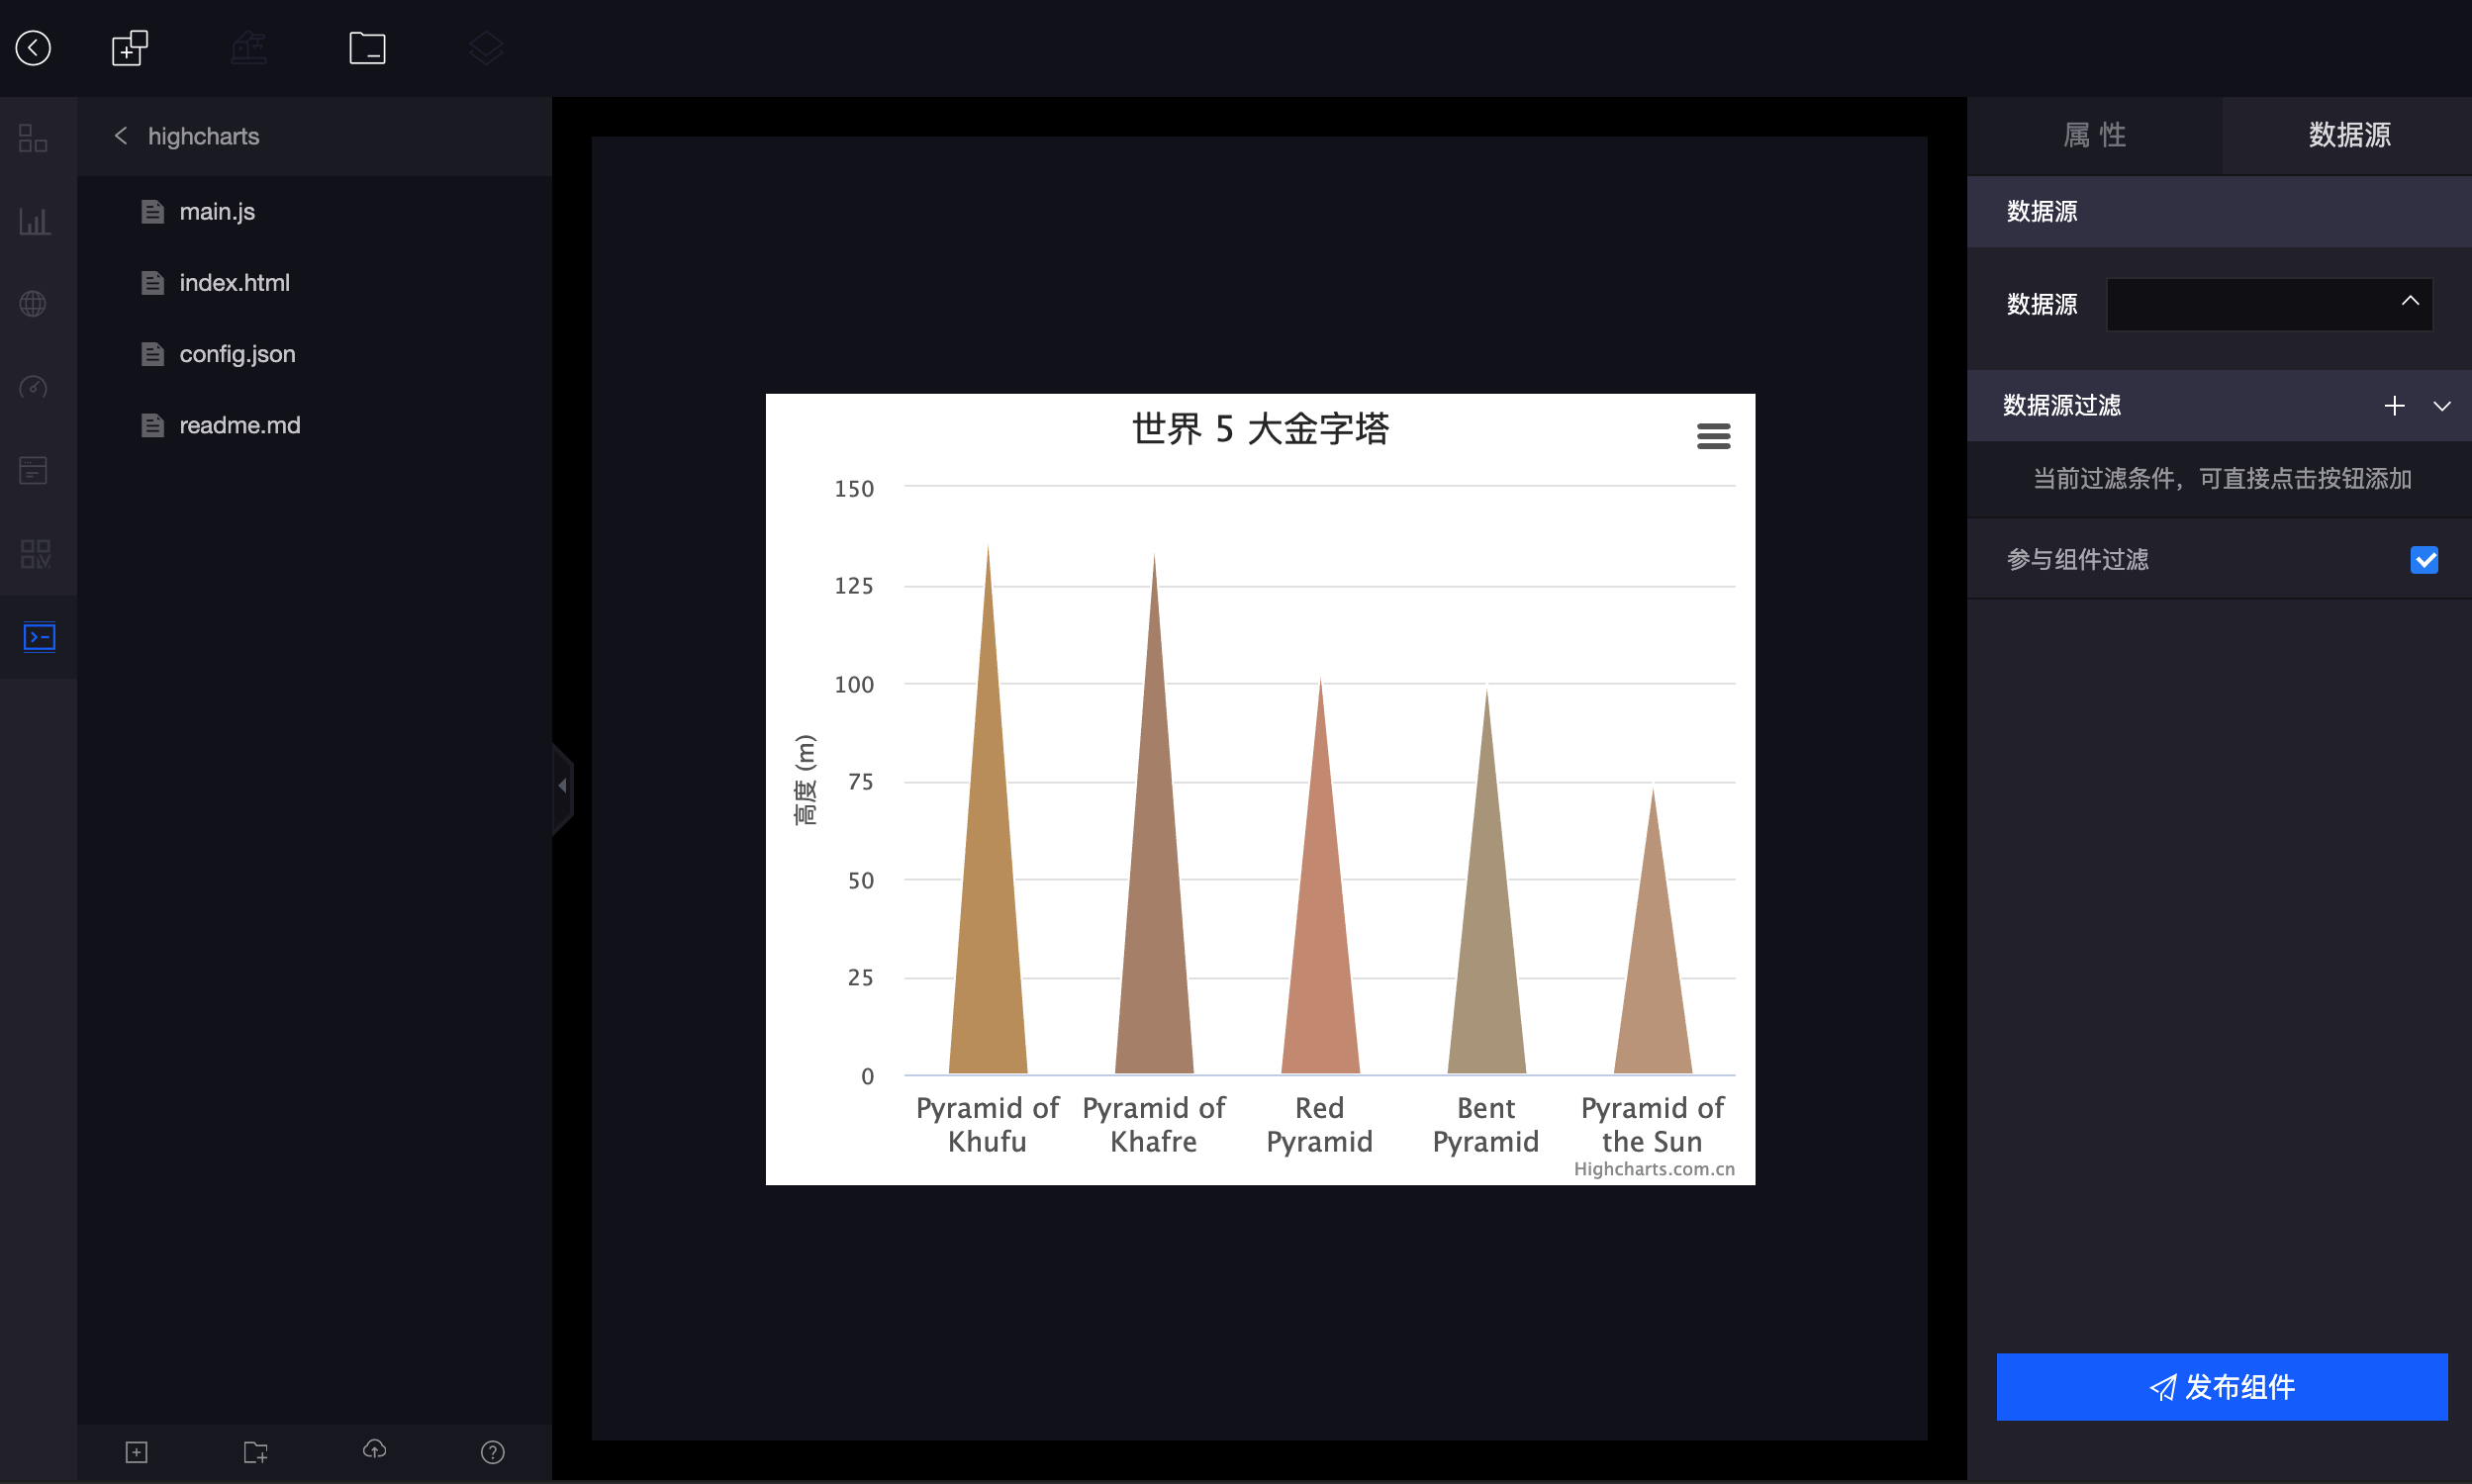
点击运行后,展示的样式:
下面我们需要处理连接数据源后,组件拿到数据后的处理。
我们在setData函数中添加打印
setData(data){
console.debug(data);
}
然后控制台显示的信息是
{
"type":"unlive",
"data":{
"c2":["北京这种","甘肃","河北","河南","云南","广州"],
"c3":[900,300,400,500,600,900]
},
"empty":false
}
setData方法还有第二个入参,我们也打印一下这个参数。
setData(data,obj){
console.log(obj)
}
返回的数据结构比较多,我们挑选几个重要的进行讲解。
{
"data": {
"model_id": null,
"datasourceInfo": {
"dsUuid": "189304235273500006",
"table": "t_189304234117000006",
"name": "rock数据筛选",
"mode": "",
"format": "xlsx",
"type": "file"
},
"group": false,
"filter": [],
"requestParams": [],
"measure": [{
"column": {
"column": "c1",
"type": "number",
"name": "费用"
}
}],
"dimension": [{
"column": {
"column": "c3",
"type": "string",
"name": "工单数"
}
}],
"screen": true,
"newFiels": [],
"linkageFiels": [],
"dataType": "datasource",
"isUseNewDatasource": true
},
"type": "measure"
}
data 下就是全部的数据源信息
- model_id 如果打开了物模型开关,并且选择了物模型,这里展示的就是模型id。
- datasourceInfo 这里存放的数据源相关信息。
- group 是否分组
- filter 过滤参数列表
- requestParams 请求参数列表
- measure 度量
- dimension 维度
- screen 是否参与组件过滤
- newFiels 新增字段
- linkageFiels 关联列表
其中比较重要的信息是measure和dimension,分别代表度量和维度。
measure:
{
"column": {
"column": "c1",
"type": "number",
"name": "费用"
}
},
...
dimension
{
"column": {
"column": "c3",
"type": "string",
"name": "工单数"
}
}
他们里面column的值,c1和c2 分别对应setData中拿到数据的返回值的key
{
"type":"unlive",
"data":{
"c2":["北京这种","甘肃","河北","河南","云南","广州"],
"c3":[900,300,400,500,600,900]
},
"empty":false
}
从而我们知道c2是维度的值,c3是度量的值。
下面我们在setData函数中,将数据整理成highcharts组件需要的结构。
setData(data,obj){
let dimensionList=this.$customService.getDataSourceDimensionColumns(obj.data);
let measureList=this.$customService.getDataSourceMeasureColumns(obj.data);
console.debug(dimensionList,measureList)
}
$customService中的getDataSourceDimensionColumns方法和getDataSourceMeasureColumns方法,能够帮助我们抽取维度和度量信息。
上面示例中我们用到了$customService,需要在config中的services中增加配置。
{
"develop":{
"html":"index.html",
"css":[],
"entry":"main.js",
"scripts":{
}
},
"plugins":["Highcharts"],
"libs":[],
"services":["$customService"],
"customAttributes":{
"pro":[],
"con":[
{
"type":"BiDatasourceConfigComponent",
"customInput":{
"dimensionCount":1,
"measureCount":1,
"widgetCanDrillDown":true
},
"setDataParams":{
"simple":true
}
},
{
"type":"ShadowTitleDisplay",
"name":"参与组件过滤"
}
]
}
}
并在main.js中增加引用。
(function(option){
var Highcharts=window.plugins.Highcharts;
return {
$data:{
$customService:null,
chart:null
},
$hooks:{
onInit(){
this.$customService=window.services.$customService;
}
,,,
}
,,,
}
})
dimensionList和measureList分别存储数据源的维度和度量信息,我们配置自定义组件数据源信息的时候,设置的维度和度量的数量限制都是1,所以这里维度和度量的长度最大就是1。
下面我在通过一个方法,把数据转换成最终highcharts所需要的结构。
[
['Pyramid of Khufu', 138.8],
['Pyramid of Khafre', 136.4],
['Red Pyramid', 104],
['Bent Pyramid', 101.1],
['Pyramid of the Sun', 75]
]
我们在$methods下创建一个函数,dataFormated
dataFormated(dimension,measure,data){
let list=[];
let dimensionColumnKey=dimension['column'];
let measureColumnKey=measure['column'];
for(let i=0;i<data[dimensionColumnKey].length;i++){
let cell=[data[dimensionColumnKey][i]];
cell.push(data[measureColumnKey][i]);
list.push(cell)
}
this.chart.series[0].update({
data:list
});
}
list为整理后的数据结构,最后调用highcharts的update方法更新数据。
在setData中增加调用
setData(data,obj){
let dimensionList=this.$customService.getDataSourceDimensionColumns(obj.data);
let measureList=this.$customService.getDataSourceMeasureColumns(obj.data);
if(dimensionList&&dimensionList.length>0&&measureList&&measureList.length>0)this.dataFormated(dimensionList[0],measureList[0],data.data);
}
最后的效果如下图所示:
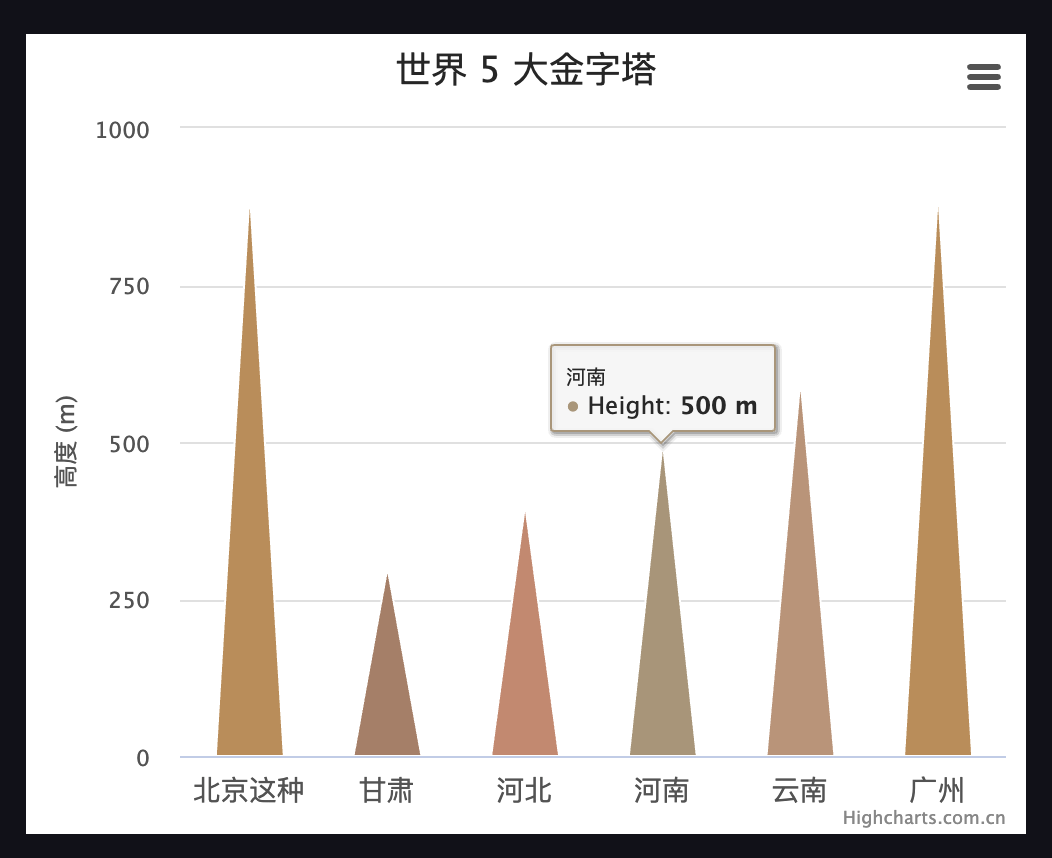
demo下载